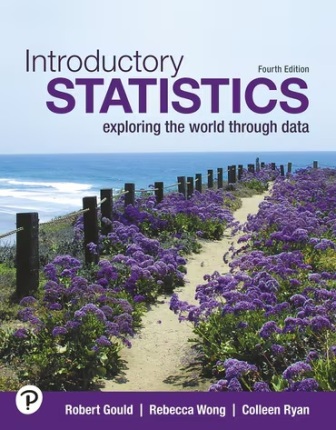
Description
Introductory Statistics Exploring the World Through Data 4th Edition Gould (Solution Manual)
Solution Manual for Introductory Statistics Exploring the World Through Data, 4th Edition, Robert N. Gould, Rebecca Wong, Colleen Ryan, ISBN-13: 9780138242145
Table of Contents
Index of Applications
1. Introduction to Data
Case Study: Dangerous Habit?
1.1 What Are Data?
1.2 Classifying and Storing Data
1.3 Investigating Data
1.4 Organizing Categorical Data
1.5 Collecting Data to Understand Causality
Data Project: Introduction: Importing Data
2. Picturing Variation with Graphs
Case Study: Student-to-Teacher Ratio at Colleges
2.1 Visualizing Variation in Numerical Data
2.2 Summarizing Important Features of a Numerical Distribution
2.3 Visualizing Variation in Categorical Variables
2.4 Summarizing Categorical Distributions
2.5 Interpreting Graphs
Data Project: The Bare Bones: Data Types
3. Numerical Summaries of Center and Variation
Case Study: Living in a Risky World
3.1 Summaries for Symmetric Distributions
3.2 What’s Unusual? The Empirical Rule and z-Scores
3.3 Summaries for Skewed Distributions
3.4 Comparing Measures of Center
3.5 Using Boxplots for Displaying Summaries
Data Project: The W’s and One H: Asking Interrogative Questions
4. Regression Analysis: Exploring Associations between Variables
Case Study: Forecasting Home Prices
4.1 Visualizing Variability with a Scatterplot
4.2 Measuring Strength of Association with Correlation
4.3 Modeling Linear Trends
4.4 Evaluating the Linear Model
Data Project: Get It Sorted: Sorting Data
5. Modeling Variation with Probability
Case Study: SIDS or Murder?
5.1 What Is Randomness?
5.2 Finding Theoretical Probabilities
5.3 Associations in Categorical Variables
5.4 Finding Empirical Probabilities
Data Project: Ask Good Questions: Posing Statistical Investigative Questions
6. Modeling Random Events: The Normal and Binomial Models
Case Study: You Sometimes Get More Than You Pay for
6.1 Probability Distributions Are Models of Random Experiments
6.2 The Normal Model
6.3 The Binomial Model (Optional)
Data Project: Transformations for a Better Analysis
7. Survey Sampling and Inference
Case Study: Spring Break Fever: Just What the Doctors Ordered?
7.1 Learning about the World through Surveys
7.2 Measuring the Quality of a Survey
7.3 The Central Limit Theorem for Sample Proportions
7.4 Estimating the Population Proportion with Confidence Intervals
7.5 Comparing Two Population Proportions with Confidence
Data Project: Make it Smaller: Subsetting Data
8. Hypothesis Testing for Population Proportions
Case Study: Dodging the Question
8.1 The Essential Ingredients of Hypothesis Testing
8.2 Hypothesis Testing in Four Steps
8.3 Hypothesis Tests in Detail
8.4 Comparing Proportions from Two Populations
Data Project: On and Off, and Off and On: Working with Binary Variables
9. Inferring Population Means
Case Study: You Look Sick! Are You Sick?
9.1 Sample Means of Random Samples
9.2 The Central Limit Theorem for Sample Means
9.3 Answering Questions about the Mean of a Population
9.4 Hypothesis Testing for Means
9.5 Comparing Two Population Means
9.6 Overview of Analyzing Means
Data Project: Non-binary Coding: Creating Multi-valued Categorical Variables
10. Associations between Categorical Variables
Case Study: Popping Better Popcorn
10.1 The Basic Ingredients for Testing with Categorical Variables
10.2 The Chi-Square Test for Goodness of Fit
10.3 Chi-Square Tests for Associations between Categorical Variables
10.4 Hypothesis Tests When Sample Sizes Are Small
Data Project: Dating Yourself: Creating New Variables from Dates
11. Multiple Comparisons and Analysis of Variance
Case Study: Seeing Red
11.1 Multiple Comparisons
11.2 The Analysis of Variance
11.3 The ANOVA Test
11.4 Post-Hoc Procedures
Data Project: What’s in a Name: Splitting and Merging Columns
12. Experimental Design: Controlling Variation
Case Study: Does Stretching Improve Athletic Performance?
12.1 Variation Out of Control
12.2 Controlling Variation in Surveys
12.3 Reading Research Papers
Data Project: Making Stacks: Stacking and Unstacking Data
13. Inference without Normality
Case Study: Contagious Yawns
13.1 Transforming Data
13.2 The Sign Test for Paired Data
13.3 Mann-Whitney Test for Two Independent Groups
13.4 Randomization Tests
Data Project: Breathe Deeply: Prepare a Data Set for Analysis
14. Inference for Regression
Case Study: Another Reason to Stand at Your Desk?
14.1 The Linear Regression Model
14.2 Using the Linear Model
14.3 Predicting Values and Estimating Means
Data Project: Is the Pen Mightier than the Keyboard?
Appendices
A: Tables
B: Answers to Odd-Numbered Exercises
C: Credits
Index


